Algebra 2 / Trigonometry

_________________________________________________________________________
Chapter Tests
Two of the tests in which I was most proud of in Algebra 2.
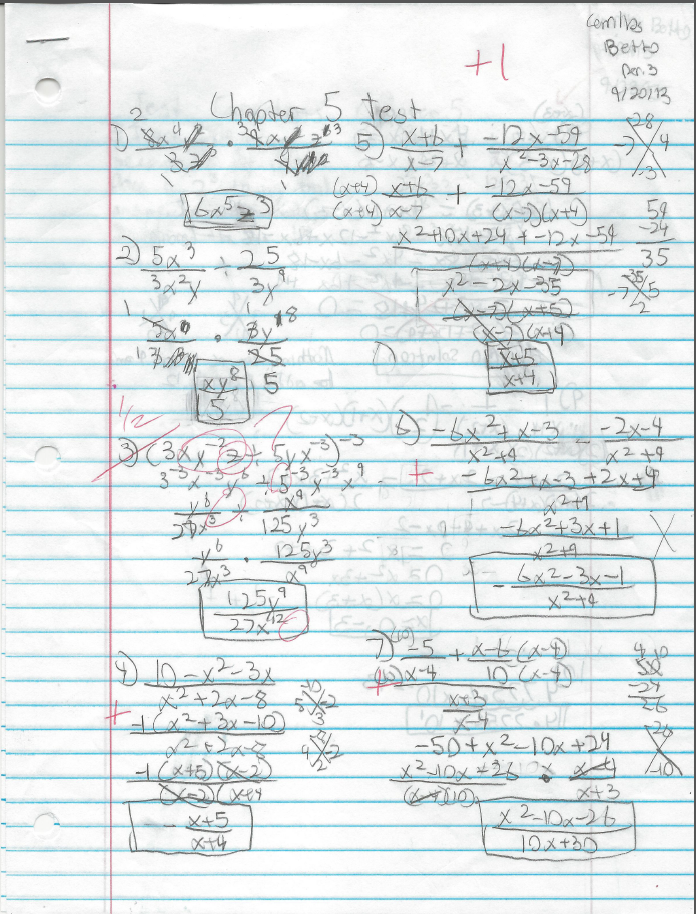
Chapter 5
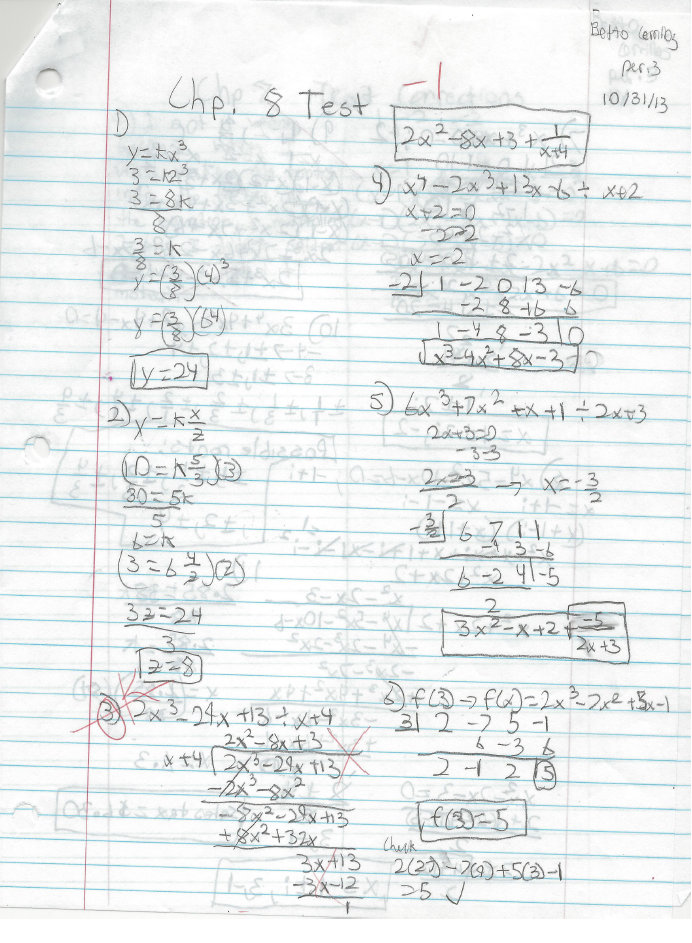
Chapter 8
______________________________________________________________________
Regression Project
Although I don't have my actual project with me currently, I do have the information of a project that was about the growth cycle of a plant. We had to do a report on it, find the line best fit for it, and write an analysis for it.
Explanation of the Experiment:
For this experiment, I was given a seed of a Mung-Bean plant to plant in a Styrofoam cup filled with dirt and then I had to record its height every day throughout 3 weeks, 21 days. In order to measure its height, I measured from the top of the cup to the top of the plant in centimeters. The plant will be left in a sun-lit environment and be given water throughout the experiment. Before I even started measuring, I came up with a hypothesis for what the growth rate of the plant will be. Every Monday, including the 4th Sunday, I took pictures of the plant to see its progress. After the 21 days, the data will be graphed on a scatter plot, and then I will write an equation for the line of best fit (I will also draw the line!) which will then be used to predict the plant’s height in the 4th Sunday, 28 days.
Hypothesis: I believe that the plant will grow at a rate of 0.5cm/day.
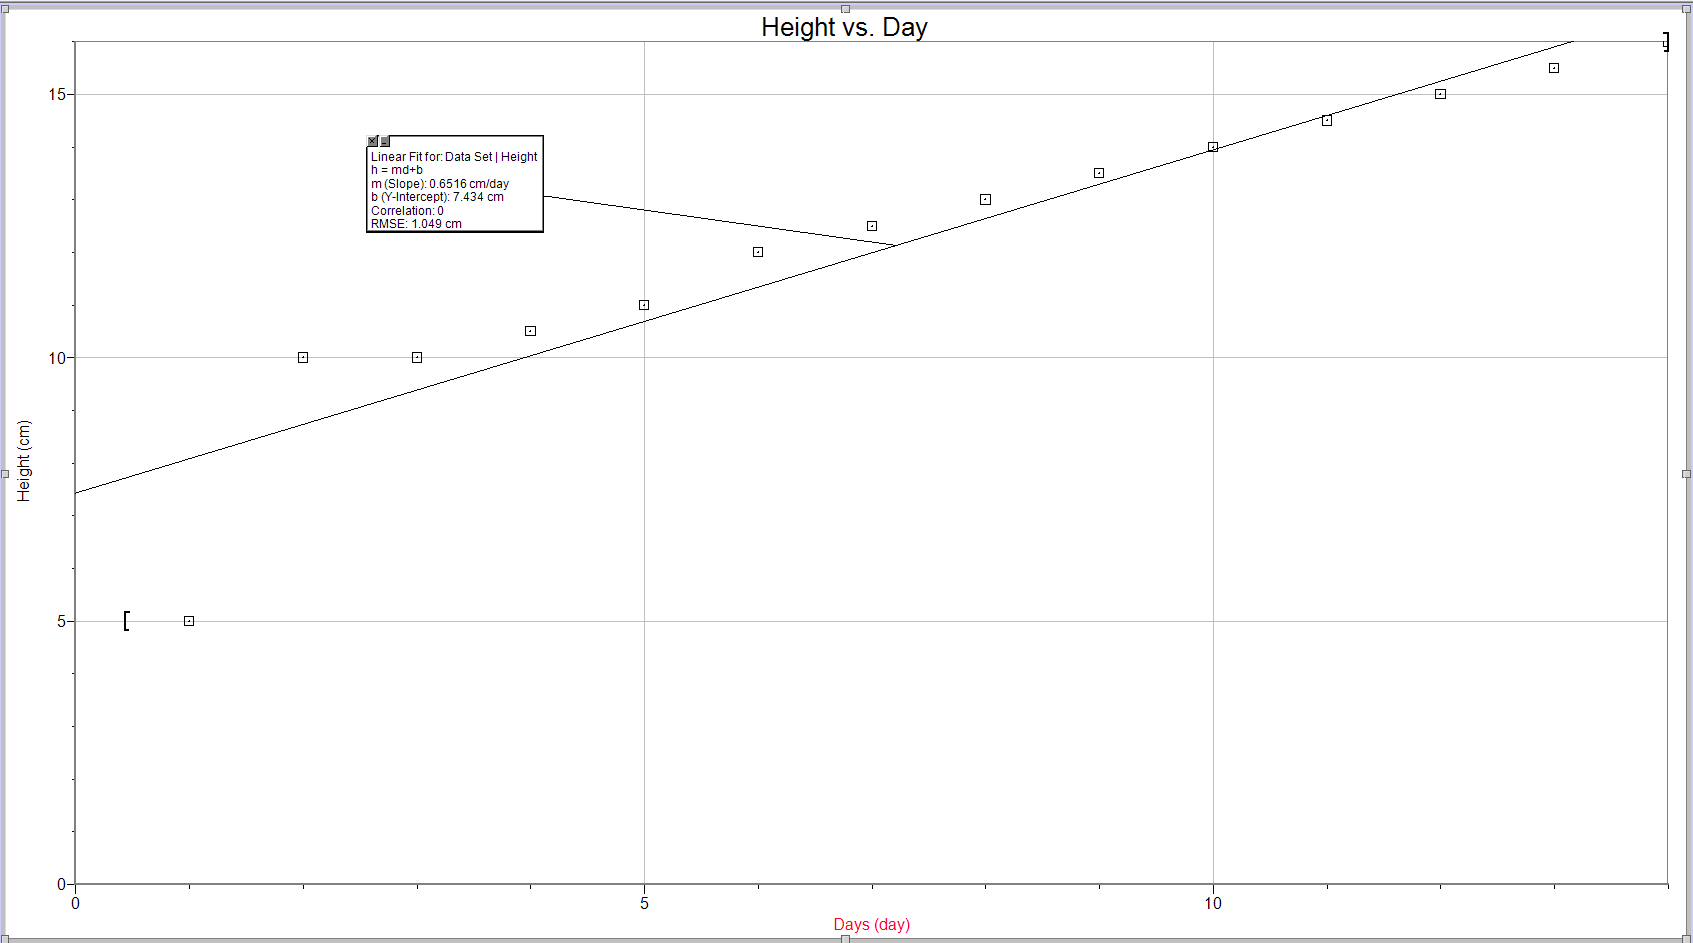
Equation:
This equation says that height of the plant is equal to the number of days times the slope plus its intercept (or initial height).
Slope- The slope means that for every 1 day, the height of the plant increases by 0.6516 centimeters.
Intercept – The intercept means that at 0 days, the plant’s height was 7.434 centimeters.
This equation is written in slope-intercept form: y=mx+b. Where y is the dependent variable (height of the plant), m is the slope (growth-rate) of the plant, x is the independent variable (number of days), and b is the plant’s initial height at 0 days. But the plant’s y-intercept should be 0cm instead of 7.434cm because it should have had no growth at 0 days.
Prediction:
4th Sunday: 25.6788 centimeters
Unfortunately, the prediction was wrong; its height was 18 centimeters by the 4th Sunday. I believe it was like that because I got the slope from using the slope from the days the plant actually grew (It did not grow from day one, but rather day 8).
Lurking Variables:
Some lurking variables I found during the experiment is the amount of sunlight the plant receives because I left it outside, so the sun is not up 24/7 and there was also gloomy weather which can hinder sunlight. Another one is the amount of water it received because I just gave the plant a random amount of water every day. Furthermore, the quality of the water could have affected it, since I just gave it sink water. Another lurking variable is the temperature, since I left it outside, the weather changed many times throughout the experiment which means that temperature did not stay constant. Moreover, the y-intercept of the plant actually has to be 0cm instead of a lower or higher value because the height of a plant at 0 days should be zero.
|
Table of Data |
|||||||
|
|
Monday |
Tuesday |
Wednesday |
Thursday |
Friday |
Saturday |
Sunday |
|
Height cm |
0 cm |
0 cm |
0 cm |
0 cm |
0 cm |
0 cm |
0 cm |
|
Height cm |
5 cm |
10 cm |
10 cm |
10.5 cm |
11 cm |
12 cm |
12.5 cm |
|
Height cm |
13 cm |
13.5 cm |
14 cm |
14.5 cm |
15 cm |
15.5 cm |
16 cm |
Explanation of results:
Basically, during the first week, my plant was dead so it was 0cm throughout, but I planted a new one around Friday or Saturday of the first week. It started growing on Sunday but it did not grow above the top of the cup so I could not measure it. It then started growing rapidly for 2 days and then started to slow down. The overall growth rate from when it was alive was 0.6516cm/day. As you can see on the graph, the line itself does not hit all of the points because it was a best to fit line, so it only calculated an average of the data points and used that as the line. Also, the plant’s growth rate was not constant throughout but it kept changing, thus is why all the points do not hit the line.
Hypothesis Met?
The hypothesis was almost on track, it was off by around 0.15 cm. Despite this, overall the hypothesis was met because the difference is really small considering it is smaller than a centimeter.